Score Every Driver, Reduce Every Risk
Harsh acceleration, hard braking, sharp cornering, speeding, and idling, all measured automatically from the GPS device in the vehicle. Turn raw telemetry into a driver scorecard your operations team can actually use.
What the Platform Actually Measures
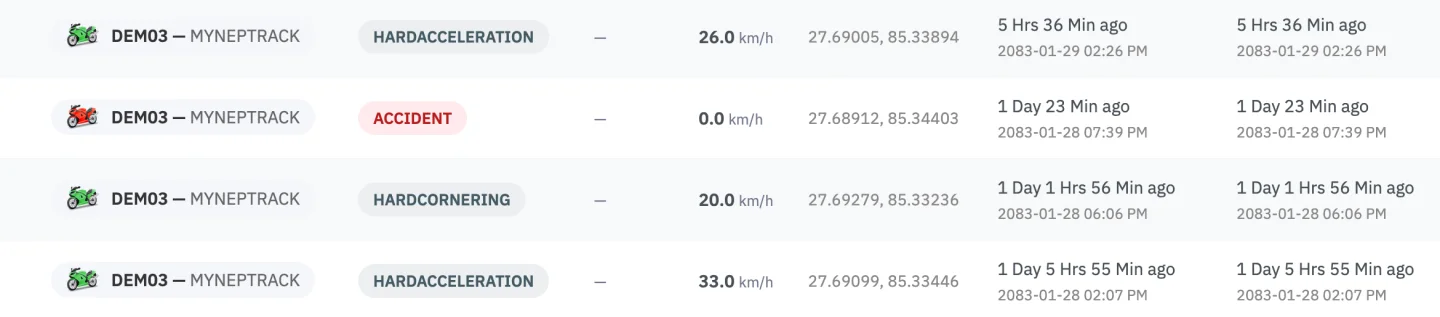
Every event recorded by the GPS device, timestamped and tied to the vehicle, the route, and the driver on the trip.
Harsh Acceleration
Aggressive throttle inputs that waste fuel and signal risky overtaking. Recorded the moment they happen.
Hard Braking
Sudden deceleration events that point to tailgating, inattentive driving, or genuine close calls. Each event is logged with location.
Sharp Cornering
Lateral G-force during turns. High cornering forces wear tyres faster and indicate a driver who is not anticipating bends.
Overspeeding
Speed compared against route limits and posted limits. Configurable thresholds per vehicle type, with instant alerts on breach.
Excessive Idling
Engine on, vehicle stationary, for longer than a configurable threshold. Burns fuel, wastes engine life, and signals lazy operations.
Continuous Drive Time
Long unbroken trips that cause fatigue. The system flags drivers exceeding safe continuous driving thresholds across the day.
Night Driving Patterns
Trips during high-risk hours flagged separately. Useful for ambulances, logistics fleets, and operators with overnight operations.
Off-Route Driving
Deviation from assigned route. Combined with idling and speed, this reveals personal use of company vehicles or fuel theft routes.
Per-Trip Score
Every trip ends with a calculated score from 0 to 100. Drivers see their own scores, operations sees fleet-wide rankings.
How Scoring Works
From raw sensor data to a driver scorecard in four steps.
How Scores Are Categorised
Each driver is grouped into one of four bands based on their rolling 30-day average. Operations teams use these bands for performance reviews, bonus eligibility, and corrective training.
Built for Operators and Drivers
Scoring works best when both sides see the same data. NepTrack shows it to everyone, transparently.
For Fleet Operators
- Reduce accident rate across the fleet
- Cut fuel costs from harsh acceleration and idling
- Lower insurance premiums with verified safety data
- Identify drivers needing coaching, not just blame
- End disputes with timestamped, location-anchored evidence
- Reward top drivers with measurable performance data
- DoTM-ready audit trails for commercial fleets
For Drivers
- See your own score in the NepTrack mobile app
- Know exactly which events hurt your score
- Compete fairly on a transparent ranking
- Build a verifiable safe-driving record over time
- Get notified before harsh events become a pattern
- Avoid wrongful blame with verified GPS evidence
- Earn performance bonuses tied to real driving data