GPS Tracking Based Traffic Management
for Real Nepali Cities
First Time in Nepal
Aggregated GPS data from thousands of vehicles turned into live congestion intelligence for Kathmandu, Pokhara, Biratnagar, and every Nepali city that needs it.
From Ring Road Gridlock to Smart City Intelligence
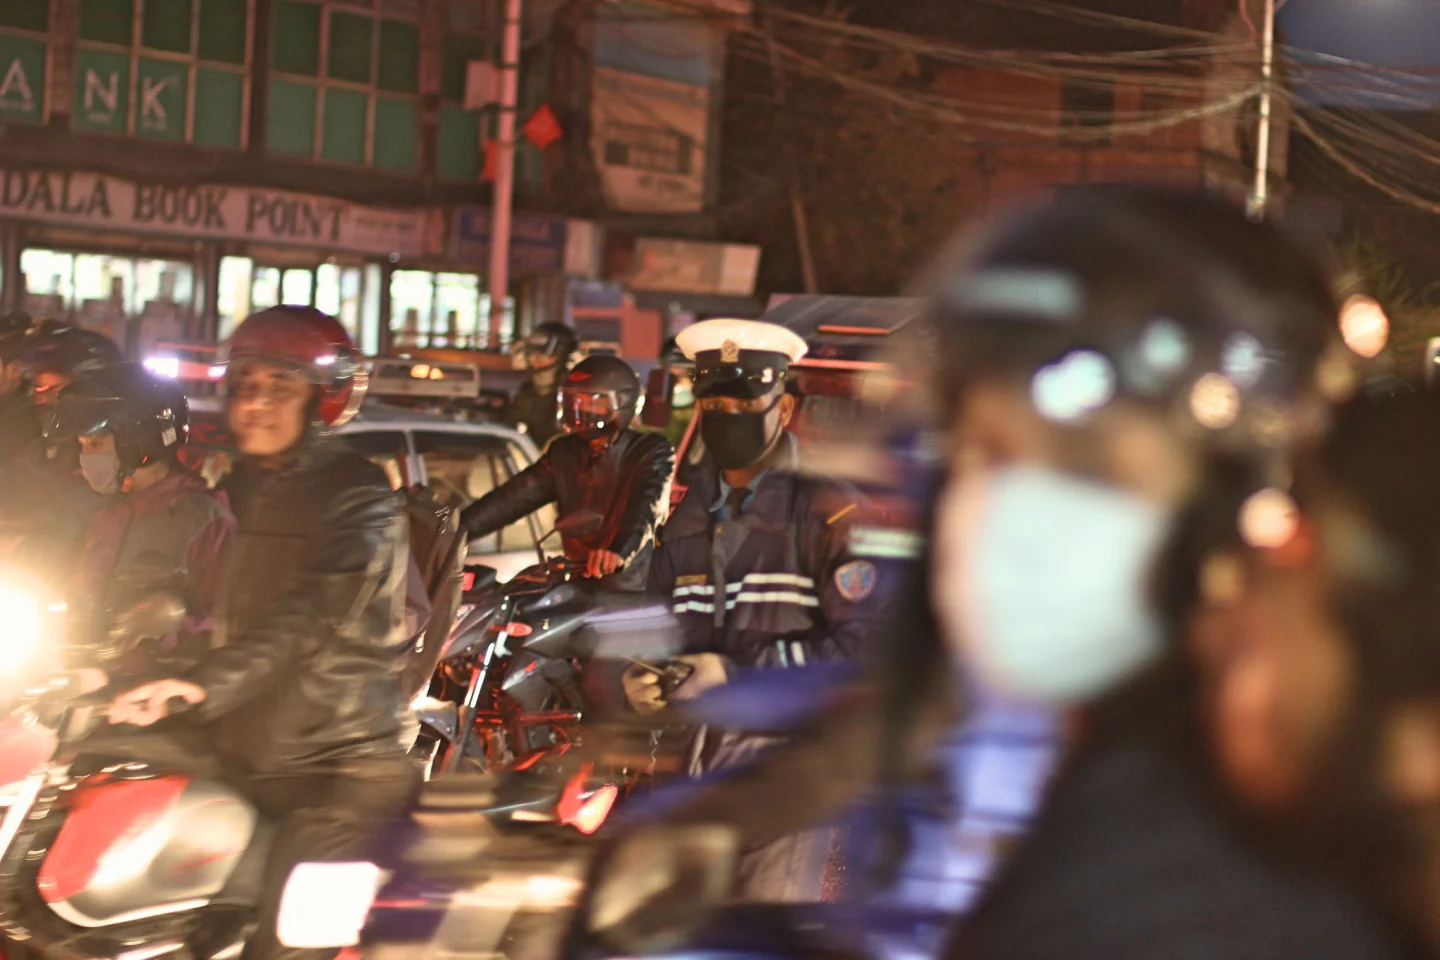
Kathmandu Valley moves slower every year. Pokhara's Lakeside chokes during tourist season. Biratnagar, Birgunj, and Butwal face the same congestion problems with no data to plan around. NepTrack Traffic Management takes anonymised, aggregated GPS data from the fleets already on the road, and turns it into actionable traffic intelligence for city planners, traffic police, and commuters.
From Vehicle GPS to City-Wide Traffic Intelligence
What You Can Actually Do With This Data, Future Ready
See Every Road Coloured by Real-Time Speed
The whole city on one map. Green roads moving freely, yellow roads slowing down, red roads at crawl pace. Updated every few seconds from the fleet vehicles already driving those streets. No guesswork, just current ground truth.
Find the Real Cause of Daily Congestion
Why does Maitighar Chowk choke at 5:30 PM every weekday? Why does Lakeside slow during Dashain? Historical data broken down by hour, day, season, and event lets planners understand patterns instead of reacting to symptoms.
Send Vehicles Around Congestion, Not Into It
Fleet operators running buses, ambulances, logistics trucks, and delivery vehicles get live route guidance that accounts for real Kathmandu conditions. Not estimated time from a global map, but the actual state of Ring Road right now.
Data for the People Who Manage the City
Traffic police, metropolitan engineering departments, and city planners get a dedicated dashboard. See where the worst bottlenecks form, measure road change impact, plan one-way conversions with real data, and respond to incidents with verified information.